WST-8 or CCK-8 is a colorimetric assay that can be used on cell counting or cytotoxic analysis, based on the cell metabolism. Compare to MTT or other metabolism viability assays, WST-8 is more sensitive and requires shorter time of incubation. In addition to that, the cytotoxicity of the assay is very little, hence experimenting over longer period becomes possible. However, WST-8 has its own limit, especially when the total cell number is too large. In the protocol, the maximum cell number is 25,000 cell for one well in the 96-well plate. In this post, with U87MG cell line, the WST-8 standard curve can be visualized, and the limit and saturation can also be analyzed.
Note: this post can only be used as a reference. To determine the actual limit of your own WST-8 kit with your cell lines, please make your own standard curve.
Experiment Configuration
- Cell Line: U87MG
- Cell Seeding Vessel: 96-well plate
- Plate Reader: Thermo Scientific plate reader
- Assay: Dojindo Cell Counting Kit-8
- Culture Media: DMEM, with phenol red
Note: for the plate reader, according to its manual, the read-out range is 0~4 Abs. After 4.0, it will display 6.0. Hence we need to manually change it to the 4.0, the saturation point.
In addition, the plate reader can provide accuracy, linearity, & precision when the reading is under 2.5 Abs, and when the reading is within the range 0~2.0 Abs, it has better performance.
As a result, it is better to keep the reading below 2.0.
Experiment Procedure
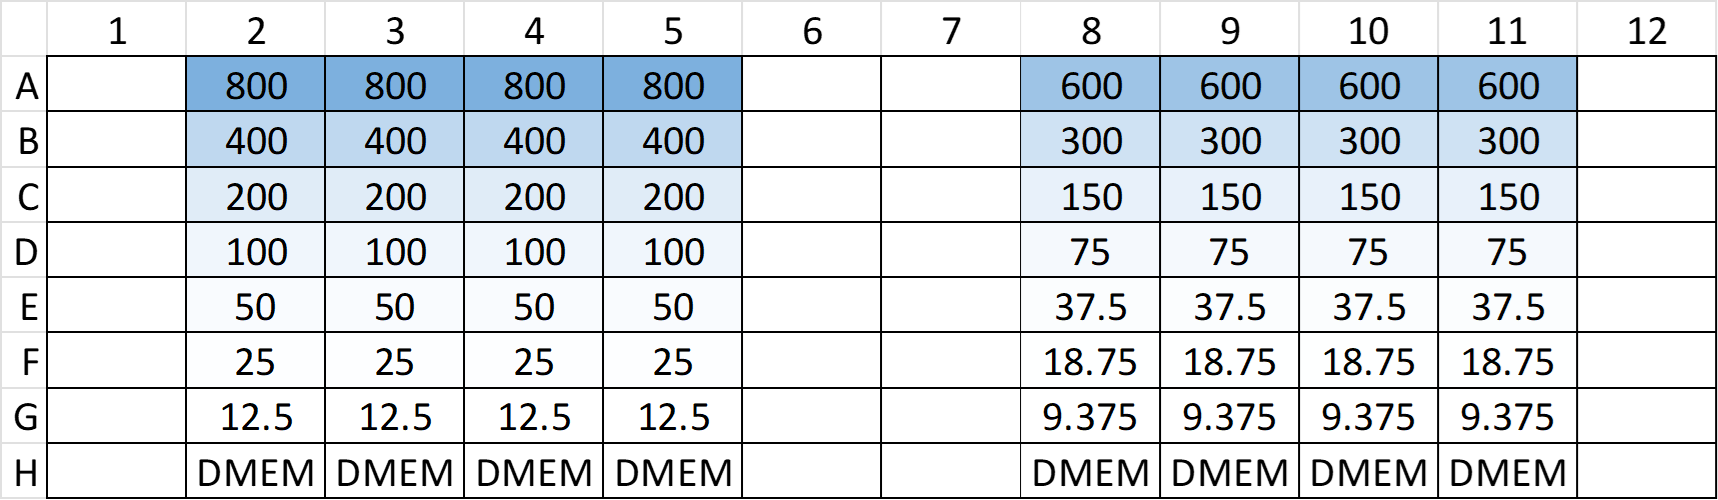
- Seeded the cells on a 96-well plate, where 8 columns were utilized to have 2-fold serial dilution of seeding.
- Column 2 ~ 5 had the maximum seeding density at 800 k/mL
- Column 8 ~ 11 had the maximum seeding density at 600 k/mL
- Both 4-columns were 2-fold serial diluted, from row A to row G
- Row H was filled with DMEM only (no cells)
- The configuration can be seen in the following figure
- The 2-fold serial dilution was performed as follows:
- Added 100 uL of DMEM to each well of row B ~ H, column 2 ~ 5 & 8 ~ 11, leaving row A empty
- Added 200 uL of cell suspension to row A, column 2 ~ 5 (800 k/mL); column 8 ~ 11 (600 k/mL)
- Used multi-channel pipette to transfer 100 uL from row A to row B, performing 2-fold serial dilution
- Kept serial diluting until row G, where the rest 100 uL was discarded, leaving row H only DMEM
- After 24 hours of seeding, added 10 uL WST-8 to each well, skipping empty wells.
- Incubated the plate for 1, 2, 3, 4 hours, and read it on a microplate reader (450nm)
Experiment Results
Raw Optical Density (OD)
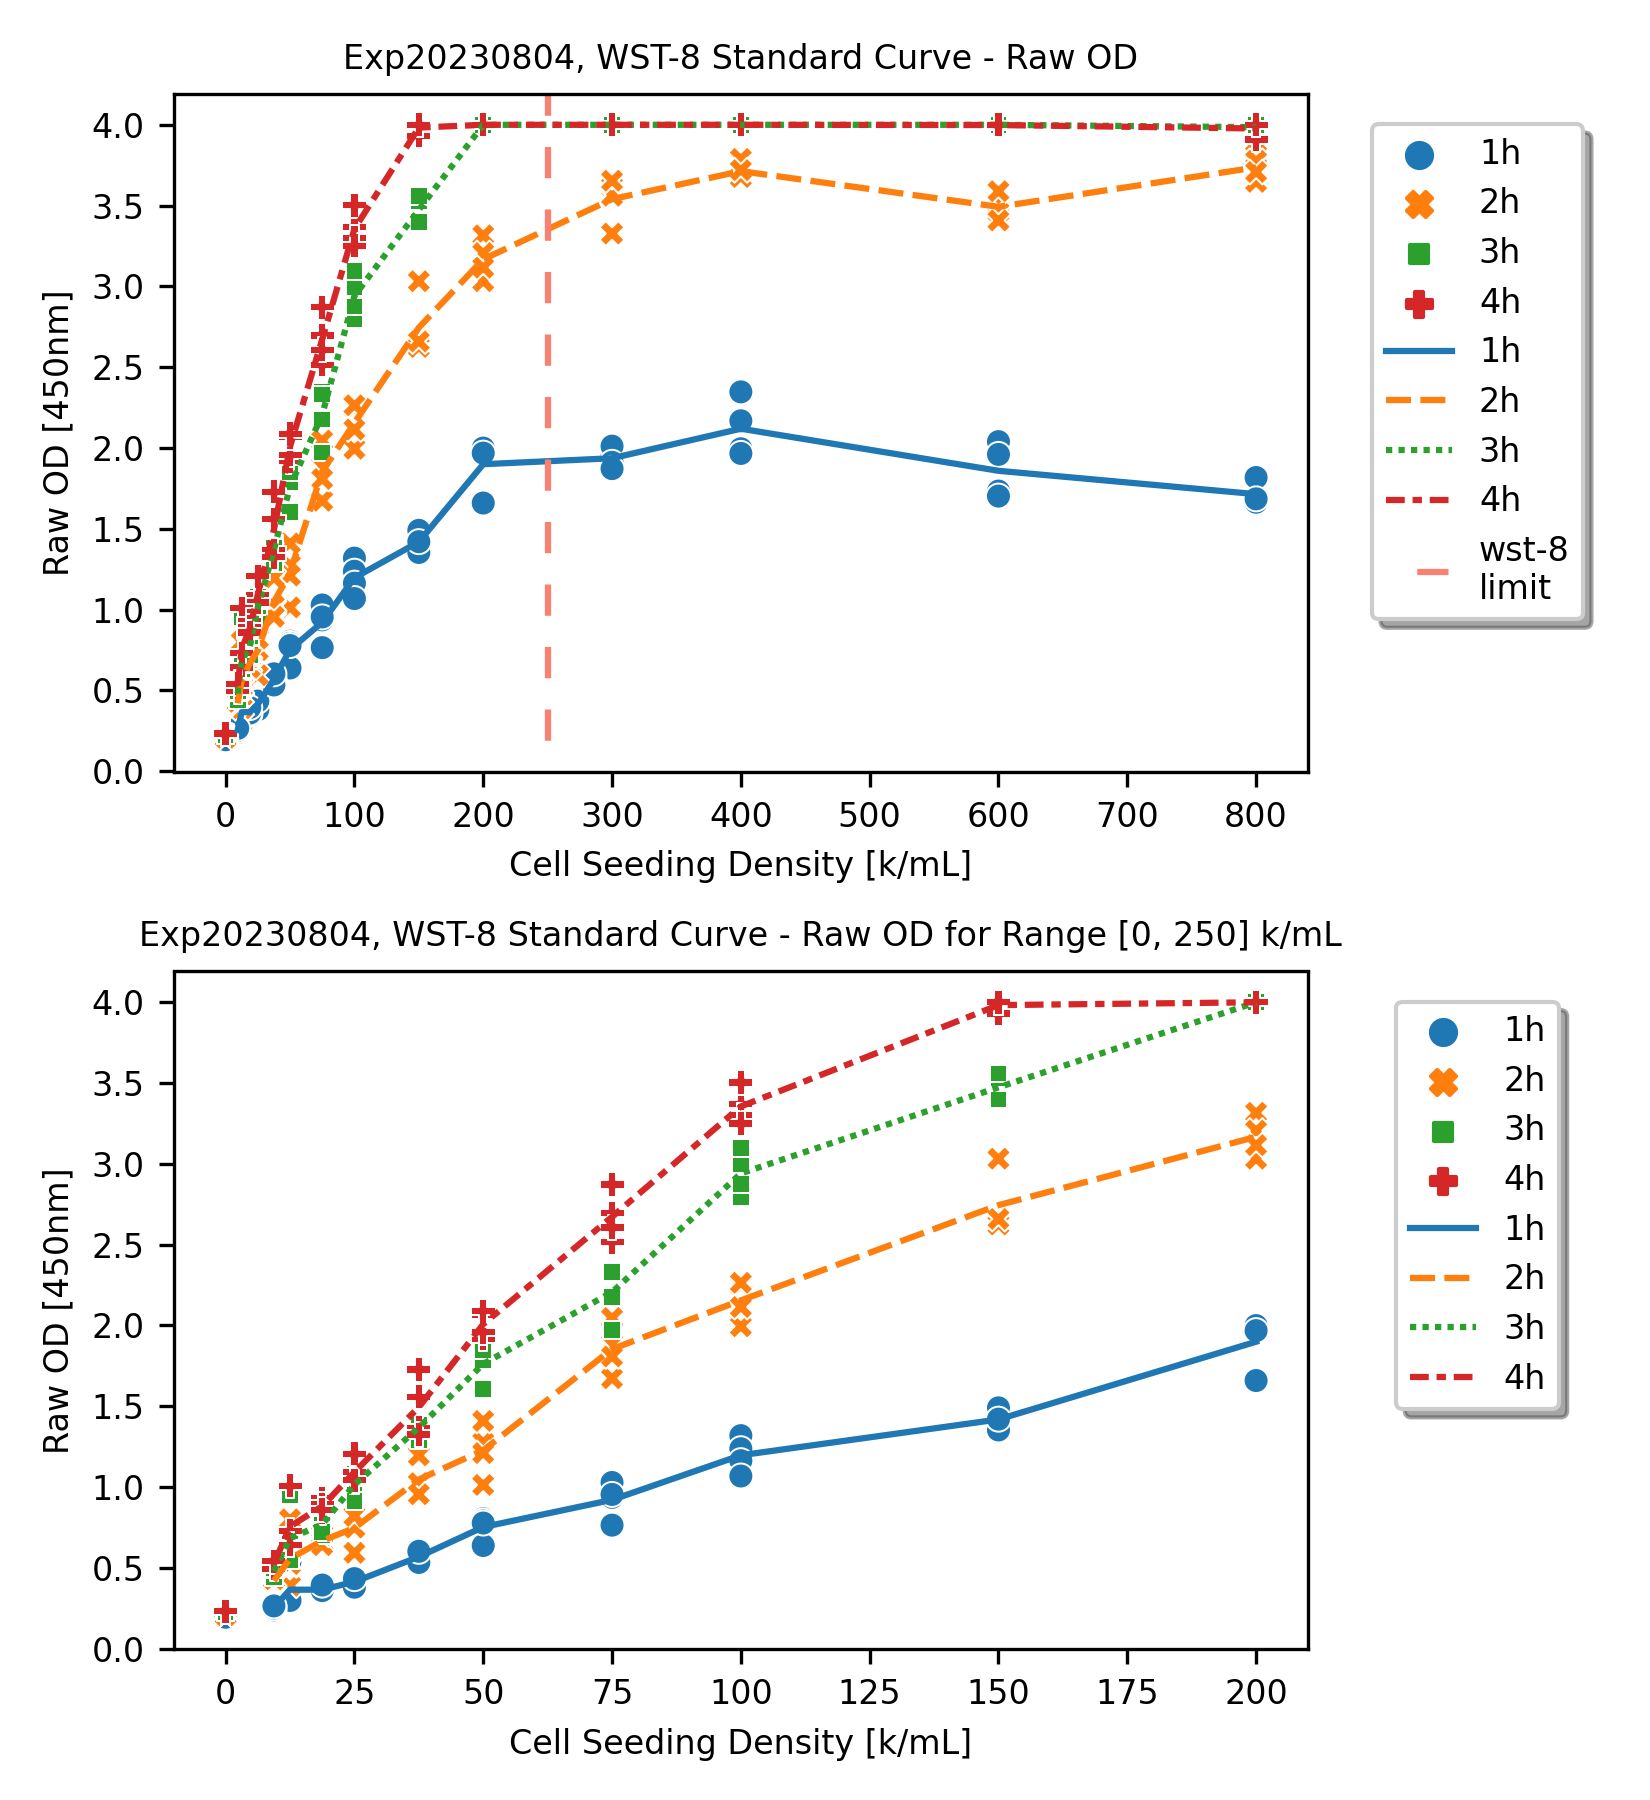
For the figure on top, we can see the full range of measurements, where the x-axis is the seeding density, and the y-axis is raw OD readings, from the plate reader. The limit indicated by the WST-8 protocol is visualized with a vertical dashed line.
As it is illustrated, for all 4 readings (readings on 1, 2, 3, 4 hours), after the WST-8 limit line, the readings were all saturated. For 3-hour and 4-hour cases, the measurements were mainly reaching to the plate reader capability, i.e., capped at 4.0.
If we focus only on the “working range” suggested by the protocol, the the standard curves are more linear.
Raw Optical Density (OD) with Local Outlier Factor (LOF) Outlier Removal
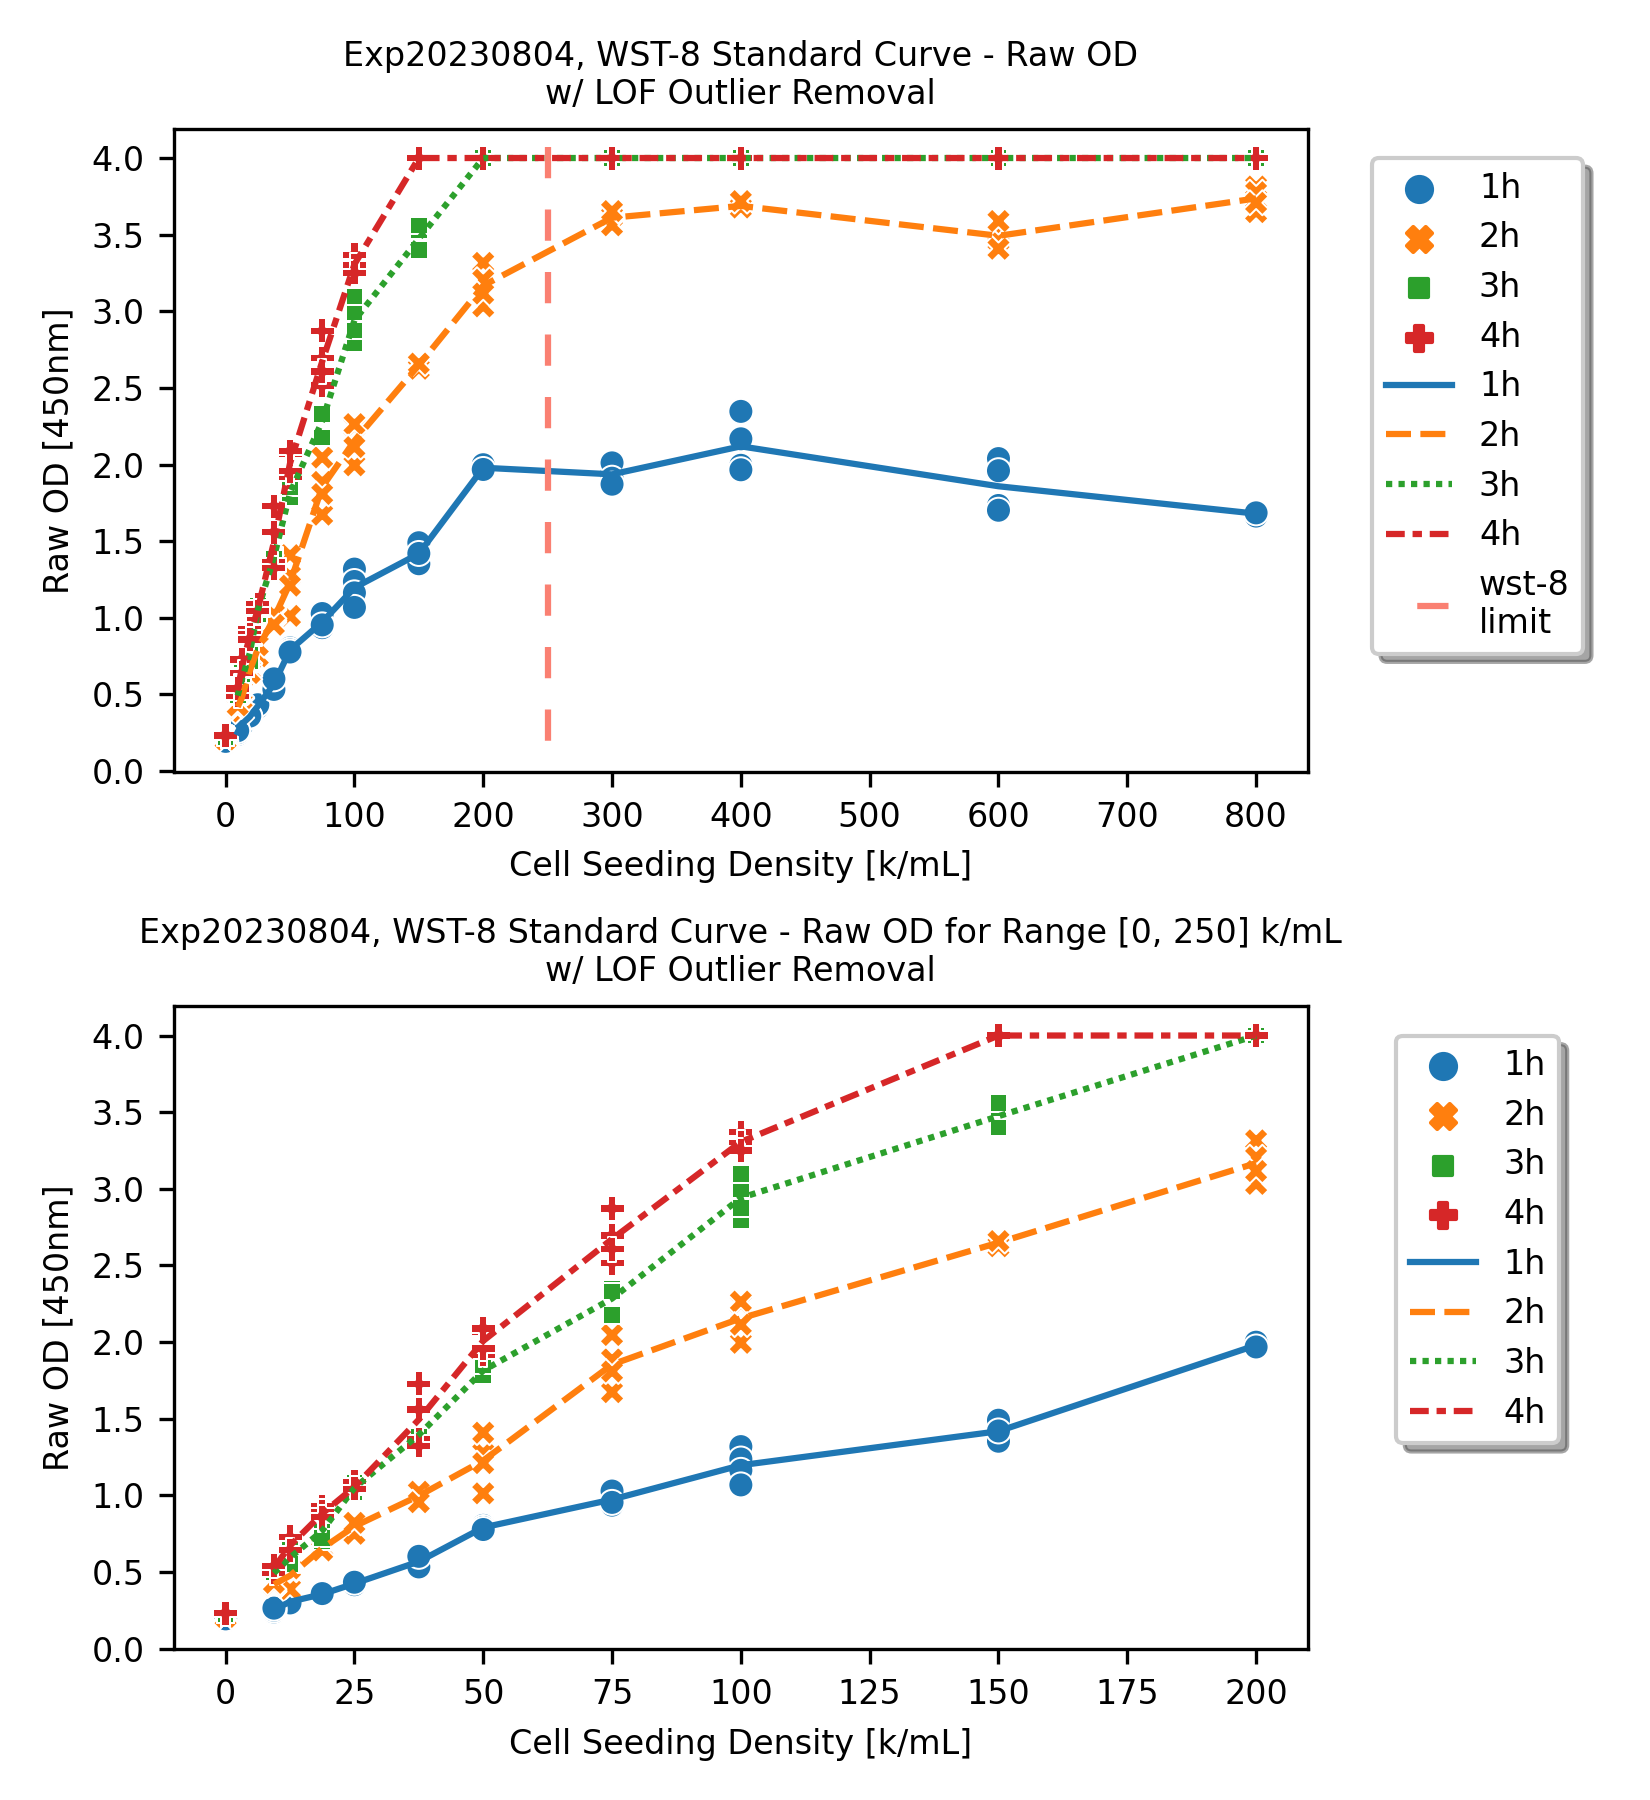
For each cell seeding density group, although some degrees of coefficient of variance are expected among the 4 replicates, there are some extreme data points can be marked as outliers and can be removed.
For this post, the Local Outlier Factor (LOF) outlier removal was utilized on the 4 replicates. More details about the LOF outlier removal can be found in the scikit-learn link: Outlier detection with Local Outlier Factor (LOF)
After the outliers were removed from the dataset, we can observe the saturation better.
Linear Regression (LR) on the Background Subtracted OD within the Working Range
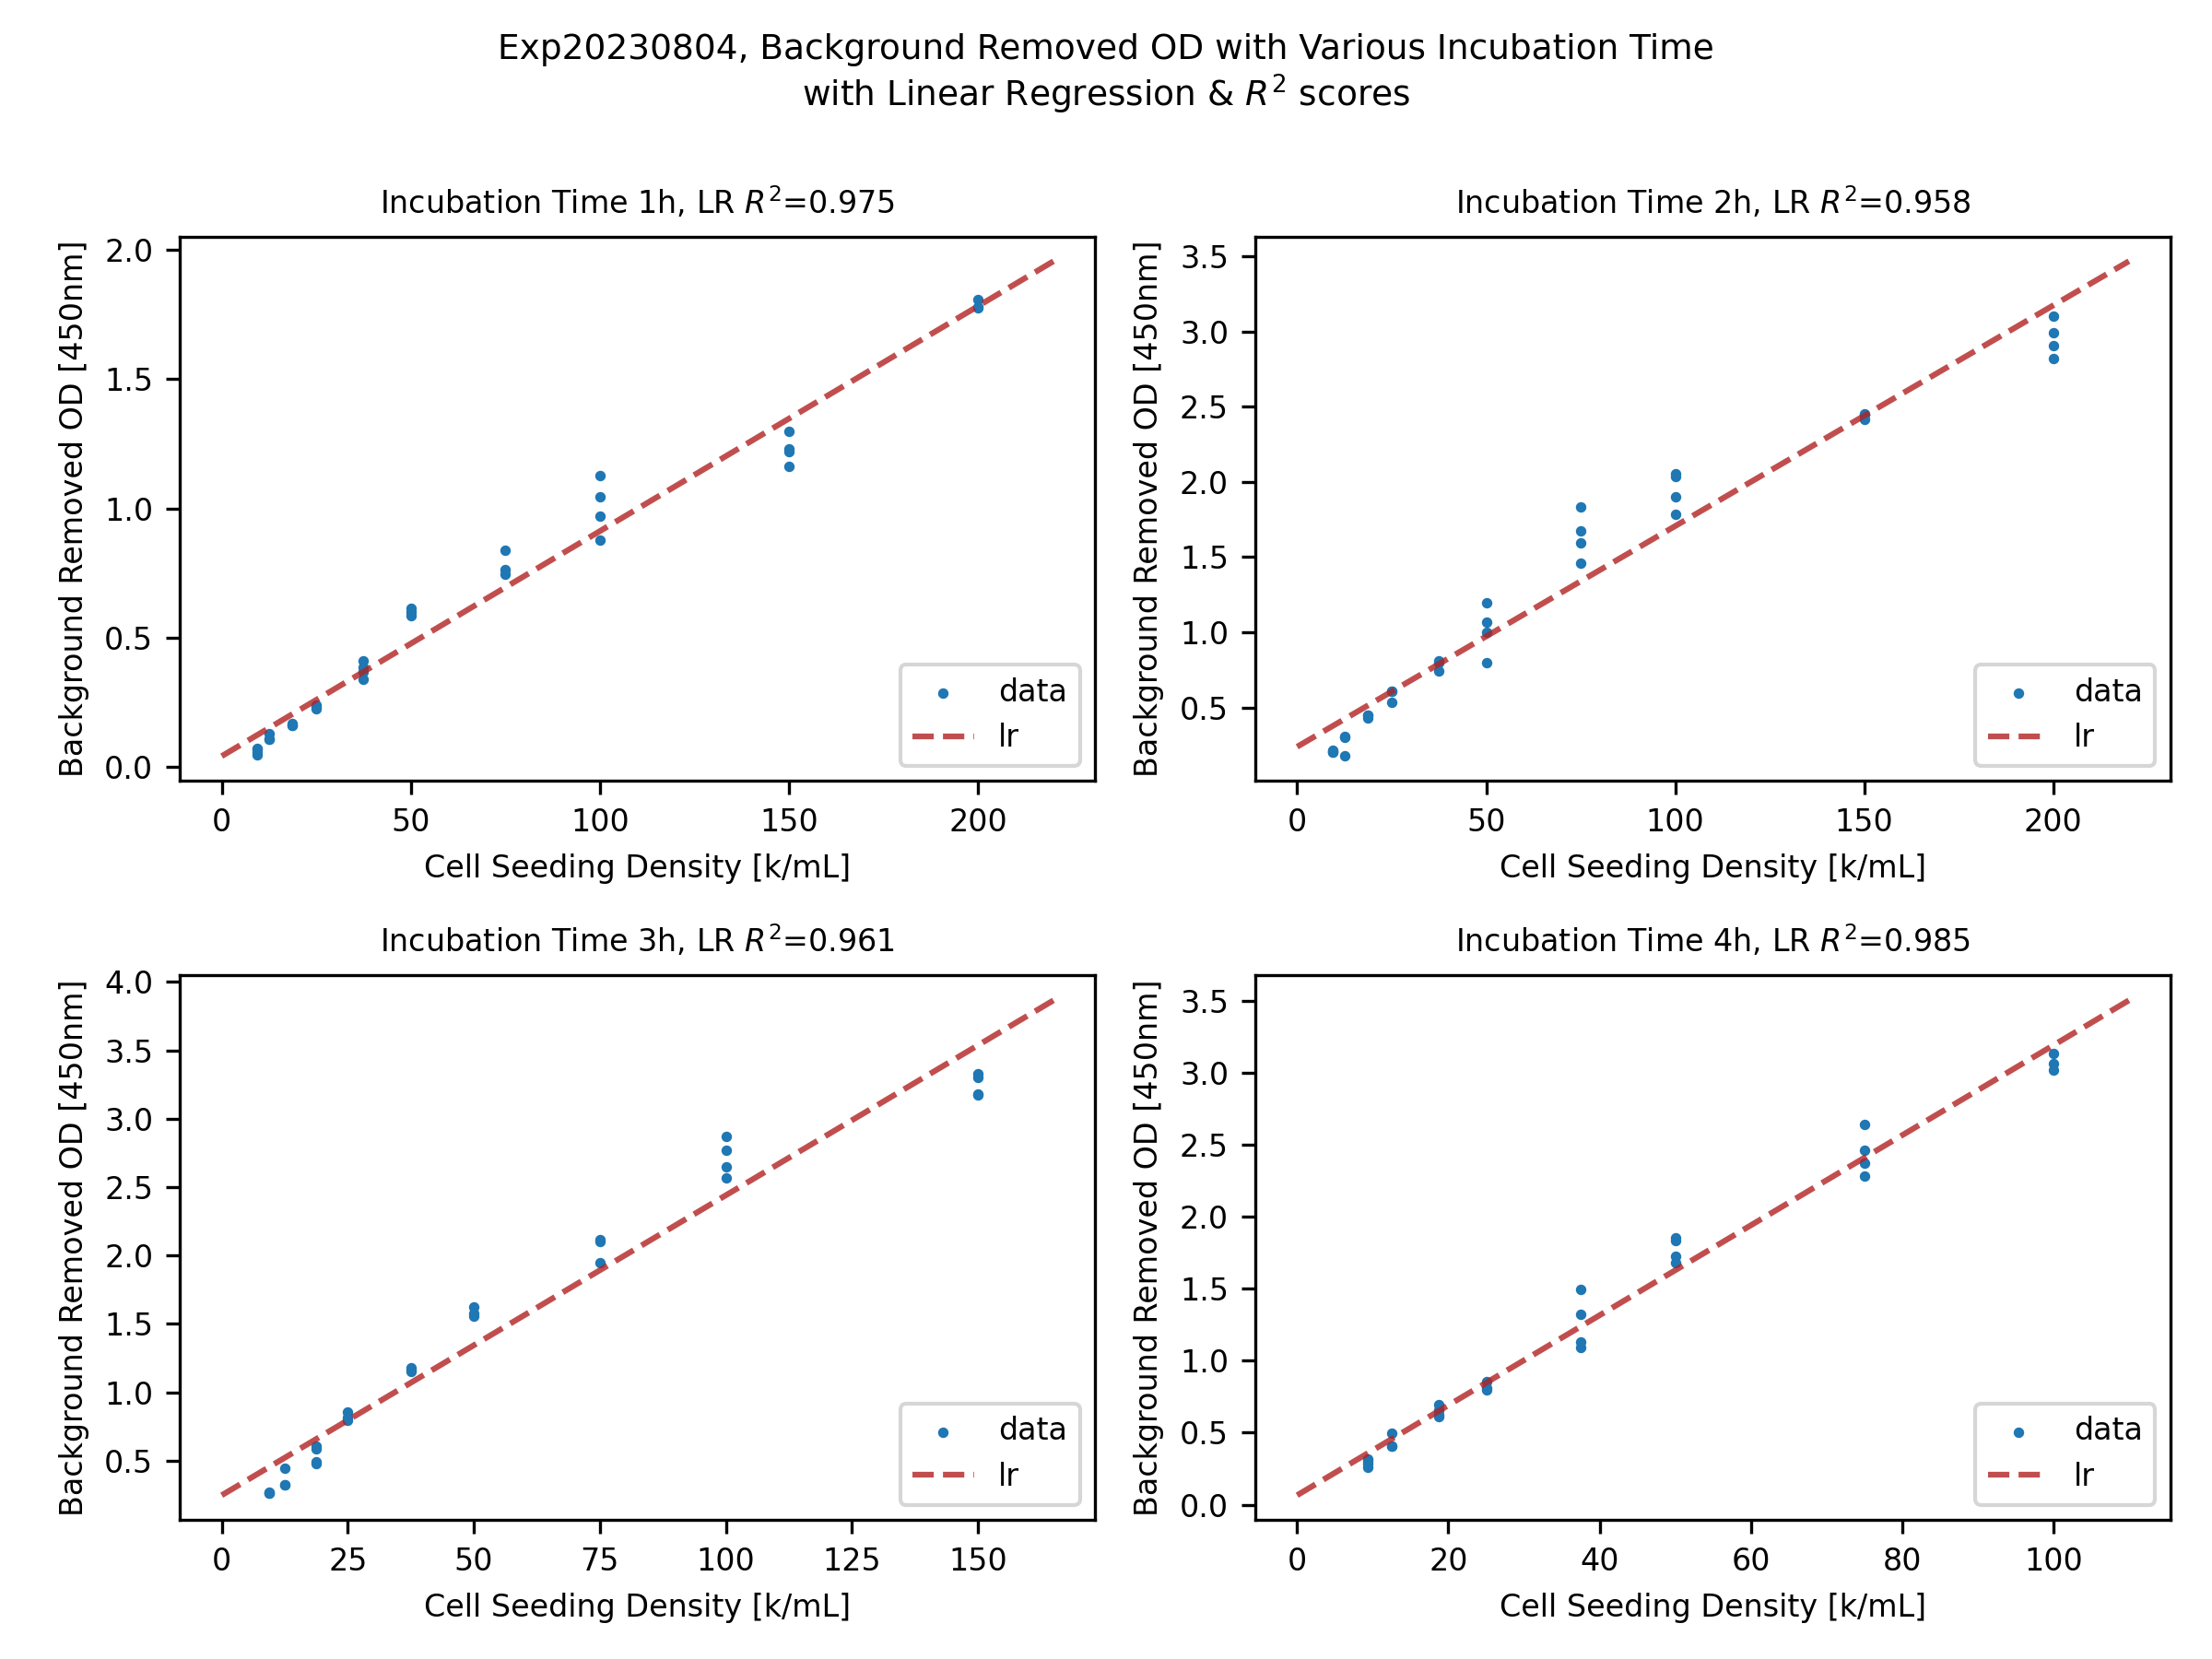
With the outlier removal, the raw OD values can be further processed with background subtraction, where the DMEM with WST-8 (no cells) wells can be seen as the background.
To assess the linearity of the assay, within nominal working range (again, indicated by the protocol), a simple linear regression can be applied.
As one may see from the figures above, both 1, 2, 3, 4-hour cases have pretty decent linearity, by checking the R^2 score of the data fittings (showing in the titles).
Some cases might have higher R^2 score, but in general, they are at the same level of linearity.
Conclusion and Thoughts
With U87MG cell line, when the total number of cells in each well is within the working range, the linearity of the assay is good. When more cells are present, the WST-8 assay reaches to its limit fairly quickly.
This saturation is expected, since it was indicated in the protocol. As a result, to avoid hitting the saturation, we may need to seed the cells at a lower density. However, for many in vitro experiments, even with a low cell seeding number, we may need to incubate the cell culture vessel for days, resulting exponential growth of cells. By the end of the experiments, when we need to use WST-8 assay to assess the cell number, the total cell number may way over the assay’s saturation point.
Therefore, to fully utilize this assay, when designing experiments, we need to choose the cell seeding density carefully. If a large number of cells is needed, maybe a different cell counting approach is needed.